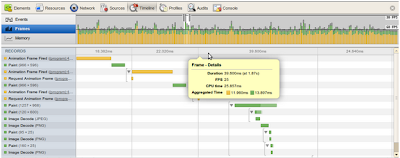
So, what’s a frame? A frame includes all the tasks that the browser needs to perform in order to update the screen upon a user action or a tick of the animation timer. A complex, but not uncommon, sequence might be:
- run JavaScript animations and other event handlers
- update CSS animations
- recalculate styles and lay out the elements in the DOM
- re-paint the updated layers of the page
- compose them and present to the user
To see how using Timeline can help you, run your favorite browser-based game, then open Developer Tools and record the Timeline while the game is running some animation. The Timeline Frame mode will now show you colored bars, each representing a frame. The colors correspond to different types of timeline events:
- network activity and HTML parsing (blue)
- running JavaScript (yellow)
- performing style recalculation and layout (violet)
- painting and compositing (green)

Even if your web app doesn’t have animation in it, the notion of a frame is still useful because the browser performs a repeated sequence of actions while processing input events such as keypress, mouse actions, scrolling etc. Leaving enough time to process such events inside a frame makes your app more responsive and interactive, resulting in a better overall experience for users.
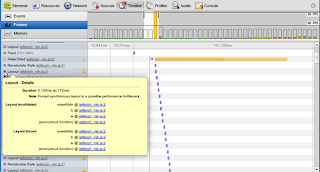
In large web applications with huge DOM trees, layout typically takes time and resources. Doing it in a loop makes things much worse. So we’ve added a warning mark on layouts that were forced, by requesting positional properties (e.g. offsetWidth and offsetHeight) of DOM elements from JavaScript. If you hover over the layout event, you can see two stacks -- one that invalidated the DOM and another that caused layout synchronously. You can also see the area that had to be re-laid highlighted on the screen.

Finally, don’t forget that the best practice for dealing with animations is to use therequestAnimationFrame API, which guarantees that Chromium will call back your animation code in sync with the display refresh.
You can learn more about optimizing rendering performance of a page in Tom Wiltzius’ article on html5rocks.com. Follow Google Chrome Developers on Google+ or @ChromiumDev on Twitter for more news on Chrome Developer Tools.
Posted by Andrey Kosyakov, Software Engineer


相关推荐
this program helps in kalman smoother learning
Cubature Kalman Smoother (CKS)的matlab实现代码。可运行
是一款将矢量线转换成平常POTOSHOP里的普通线条的插件不改变像素,达到美化矢量线的作用, 是当下日本动画制作中不可缺少的插件,鉴于我在此网站也找到能给自己工作带来实惠方便的软件,特将次插件放出方便需要的人使用....
Empower your team with the tools they need to build engaging Web applications. ComponentOne provides the ultimate UI controls from WebForms to MVC powered by the core client technology: Wijmo. Learn ...
Empower your team with the tools they need to build engaging Web applications. ComponentOne provides the ultimate UI controls from WebForms to MVC powered by the core client technology: Wijmo. Learn ...
Empower your team with the tools they need to build engaging Web applications. ComponentOne provides the ultimate UI controls from WebForms to MVC powered by the core client technology: Wijmo. Learn ...
Empower your team with the tools they need to build engaging Web applications. ComponentOne provides the ultimate UI controls from WebForms to MVC powered by the core client technology: Wijmo. Learn ...
Empower your team with the tools they need to build engaging Web applications. ComponentOne provides the ultimate UI controls from WebForms to MVC powered by the core client technology: Wijmo. Learn ...
Optimal_filtering_with_Kalman_filters_and_smoother
Empower your team with the tools they need to build engaging Web applications. ComponentOne provides the ultimate UI controls from WebForms to MVC powered by the core client technology: Wijmo. Learn ...
Empower your team with the tools they need to build engaging Web applications. ComponentOne provides the ultimate UI controls from WebForms to MVC powered by the core client technology: Wijmo. Learn ...
Empower your team with the tools they need to build engaging Web applications. ComponentOne provides the ultimate UI controls from WebForms to MVC powered by the core client technology: Wijmo. Learn ...
Empower your team with the tools they need to build engaging Web applications. ComponentOne provides the ultimate UI controls from WebForms to MVC powered by the core client technology: Wijmo. Learn ...
Empower your team with the tools they need to build engaging Web applications. ComponentOne provides the ultimate UI controls from WebForms to MVC powered by the core client technology: Wijmo. Learn ...
Maven stands out among other build tools due to its extremely extensible architecture, which is built on top of the concept "convention over configuration". This has made Maven the de-facto tool used...
论文 Bi-Exponential Edge-Preserving Smoother 的JAVA实现,可用于保边去噪,人脸磨皮,速度比双边滤波器快。
This guide shows you what all the fuss is about, and how Microsoft overhauled the latest ASP.NET release., Get acquainted with the new developer productivity features Master the new tools that build ...
monte carlo filter and smoother for non-gaussian nonlinear state space models的文献,1996年由kitagawa写的。是关于particle filter最初的文献,有研究价值
Changing a window with Ctrl-Tab, Ctrl-Shift-Tab and Window menu is now smoother Moving project files in groups other than "All" did not work correctly and is now disabled DDL for Enabling/Disabling a ...
Apple's new Xcode technology is making the development curve smoother with its easy-to-develop features and enhancements. Xcode can now write code with the performance-upgraded, brand new, ...